1. Introduction
The constantly increasing use of digital technology, both by organizations and consumers, has led to an explosion of new data coming into existence. Using ever more powerful devices, consumers are sharing media files with growing quality and, thus, size and using wearables, for example, health monitors, that are always on and generating data. On the other hand, organizations are persistently deploying new digital infrastructure, such as sensors, intelligent farming equipment, inventory trackers, to name a few that provide constant flows of data.
According to IBM, in 2020, every person on Earth generated 1.7 megabytes of data per second. In a similar vein, Forbes predicts that by 2025 more than 150 zettabytes of realtime data will need analysis. Organizations are taking advantage of the growth of Big Data, and some are using it very proactively. For example, the Business Application Research Center (BARC) states that organizations reaping the benefits of Big Data report an increase of 8% in revenue with a simultaneous reduction in costs of 10%.
This article will present an overview of Big Data and offer advice on how organizations can use Big Data to improve their performance in several areas.
2. Big Data Primer
The first discussion of Big Data appeared in an article written by Mr. Doug Laney, an analyst at Forrester Research at the time, in 2001. The paper did not mention Big Data but discussed for the first time the three main characteristics of Big Data: Volume, Velocity and Variety. The term Big Data only started appearing online in 2006-2007 and has taken hold since then.
Today, a Google search for Big Data definition will produce 1.96Bn results. However, this type of variety inevitably results in significant confusion around what Big Data is and when organizations need to start looking at specific applications and solutions related to Big Data. Furthermore, considering only the amount of data is not always sufficient since some organizations routinely process hundreds of terabytes per month, while others struggle with hundreds of gigabytes.
Instead, one way is to look at Big Data in a businesscentric manner and consider its effectiveness within an organizational context. This perspective leads to a definition focused purely on business value and not on technical aspects – We are dealing with Big Data when we cannot obtain required information within the timeframes necessary for it to be adding value to organizational activities. Or, to rephrase, organizations need the information to be available before certain events; otherwise, it is unusable.
2.1. Characteristics
The three Big Data characteristics or 3V’s, identified by Mr. Laney in his work, form the foundation used to build Big Data business initiatives and technology infrastructure. While new characteristics constantly appear and broaden the original definition, they often seem redundant and pretentious, created with a marketing purpose in mind. The original 3V’s are discussed below.

2.1.1. Volume
As the name implies, this characteristic refers to the size of the datasets that need to be processed. When discussing volume, first, we need to define how it is measured. As consumers and professionals, we are familiar with kilobyte, megabyte, gigabyte.
However, Big Data volumes go well beyond any of these quantities. Thus, a definition is necessary at this stage. The list below provides an explanation of terms used to measure data quantities, expressed as bytes, at present:
- Kilobyte – 1,000 bytes
- Megabyte – 1,000 kilobytes
- Gigabyte – 1,000 megabytes
- Terabyte – 1,000 gigabytes
- Petabyte – 1,000 terabytes
- Exabyte – 1,000 petabytes
- Zettabyte – 1,000 exabytes
- Yottabyte – 1,000 zettabytes
The above definitions are the so-called “decimal definitions” considered by the law courts to be the most appropriate in trade and commerce. The underlined volumes are the ones that are considered Big Data.
To put volume in context, it is worth noting that, according to IDC, in 2018, the amount of all data on Earth was 33 Zettabytes. This amount will grow to 175 Zettabytes by 2025.
Moreover, the emergence of COVID-19 and the associated rise in digital technology usage are likely to increase this figure even further.
2.1.2. Velocity
Velocity is the 2nd characteristic of Big Data. It refers to the speed of creating data and the rate of processing and consuming data. The emergence of new business models, innovative applications, and widespread use of portable devices has increased velocity significantly.
The US Federal Reserve estimates that in 2012 a total of 24.4Bn general-purpose credit card transactions were made, while in 2018, that figure grew to 40.9Bn, an increase of 68%. Moreover, the electronic payments trend will further accelerate because of COVID-19, since electronic transactions were the only option for most during the lockdowns, and now people are very comfortable with digital technology.
This trend, however, was visible even before the pandemic when banks started reducing the number of their Automated Teller Machines (ATMs) in some countries, like Australia.
The increased e-payment volumes are just some examples of increasing data velocity. Another example is social media. For example, Microsoft, LinkedIn’s parent company, reports that in Q4-2020, the engagements are up by 31% on LinkedIn. These engagements include text and other types of data, such as video, audio, graphics, etc. And, this assortment of data brings us to the last characteristic of Big Data – variety.

2.1.3. Variety
When related to Big Data, Variety refers to the type of data sources that need to be processed. There are three main types of data sources we need to deal with:
- Structured
- Semi-structured
- Unstructured
Structured – this data resides within enterprise systems, and its structure is well defined. Examples include Payroll, Finance, or other ERP systems.
In each case, a database stores all data. An example of such a data record is an HR system’s employee record. It will contain as a minimum an employee ID, first name, last name, and other fields, as required. Structured data has been around since the early 80s. It is the easiest to process and is the smallest of the three types in terms of quantity.
Semi-structured – this data type consists of large volumes of individual records with small size and a simple record structure. An example would be the data sent by an intelligent power meter to a central system.
Each packet has the same format: timestamp – 10 bytes, location – 10 bytes, consumption – 10 bytes + other information – 80 bytes. Thus, information about electricity consumption takes 110 bytes. However, the 110 bytes is misleading since the daily volume in a city of 500,000 households with 5-sec intervals will be 950GB (110126024500,000). Within a month, this dataset will grow to 11.4 Terabytes, and after one year, its size will reach 137 Terabytes.
Intelligent electricity meters are just one example of semi-structured data. With the continued proliferation of Internet-of-Things (IoT) devices, semi-structured data will be the fastest-growing one of the three types. Unstructured – strictly speaking, this data is still structured. However, in this case, we’re dealing with many different structures and formats. A more accurate term will be multi-structured; however, unstructured is currently used for one reason or another.
Examples of unstructured data include social media posts, such as audio, video, graphics, and text. Additionally, external systems, data from enterprise sources, such as Word files, emails, and PDFs, are included here.
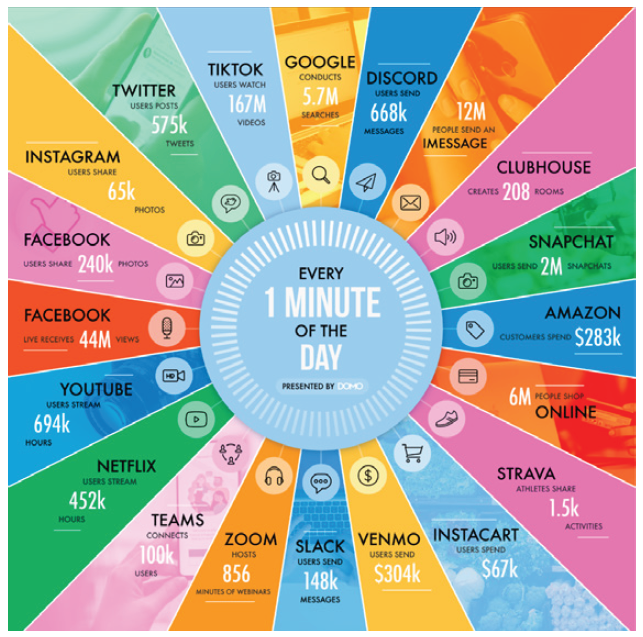
Figure 1 shows the wide variety of data items generated every minute in 2021. Some highlights contributing to Big Data include users sharing 240k Facebook photos, watching 16 million TikTok videos, and hosting 856 minutes of Zoom webinars.
2.2. Big Data Primer – Summary
Figure 1 highlights the continuous significant growth in Big Data in all three characteristics – volume, velocity, and variety. However, this infographic presents only part of the picture – the data generated by the activities of individual consumers. Even higher data volumes are coming from organizations in various industries. And, this growth in Big Data is sure to accelerate significantly during COVID-19 and afterward, as organizations adopt new technologies and deploy new infrastructure, while “connected” consumers adopt new ways of connecting, shopping, and working with great confidence.
3. Big data applications in improving organisational performance
Considering the large number of possibilities Big Data provides for organizations, it can be daunting sometimes to decide where to start.
The first thing to consider is that Big Data is not a technology but a business initiative. In Big Data, as in any other project, focusing on technology at the expense of business benefits is a recipe for failure.
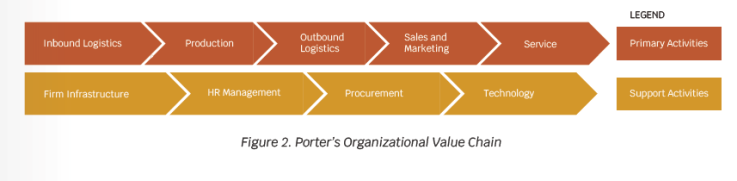
A helpful approach in deciding where to apply Big Data in an organization is evaluating the organizational value chain. Michael Porter developed the value chain in his 1985 bestseller – Competitive Advantage (Figure 2). To create value for its customers, an organization needs to perform these activities. According to Porter, the activities are directly linked to competitive advantage and their analysis to superior performance.
Since both Big Data and Porter’s value chain focus on competitive advantage and performance improvement, using the value chain as a guide for Big Data is a natural fit. Each one of the activities is a suitable candidate for a Big Data approach, but it helps to focus on a single one at a time. Every organization will determine the starting point depending on multiple factors, such as strategy, industry, external market forces, organizational culture, etc. Several examples are of possible Big Data applications are discussed below.
3.1. Procurement and fraud
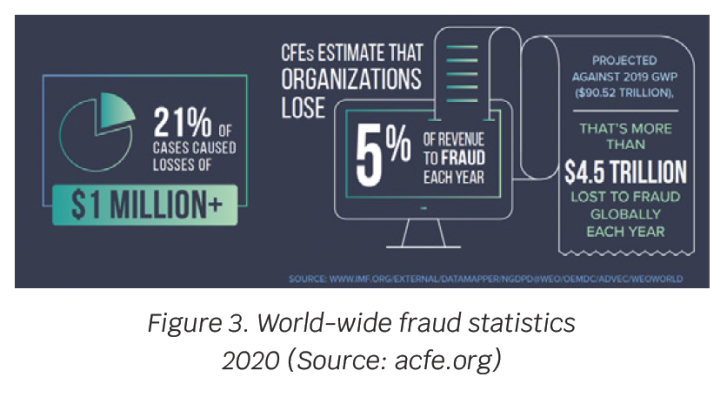
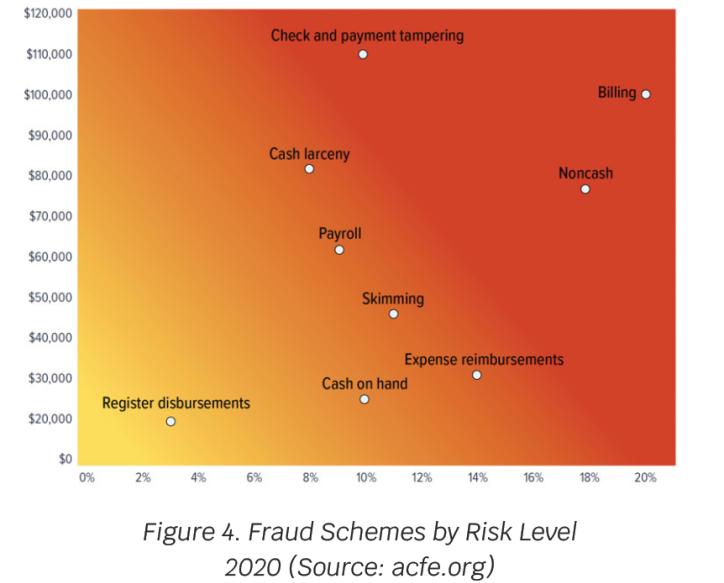
Association of Certified Fraud Examiners (ACFE) estimates that occupational fraud is responsible for a 5% loss in organizational revenue (Figure 4). Many fraud schemes exist, with the most prevalent of them being billing fraud, which is part of the procurement cycle (Figure 5). Consequently, using Big Data to detect and prevent billing fraud will significantly impact profits and performance.
A method to use Big Data against billing fraud is to combine emails from suppliers, transactions from the procurement system(s), successful tender, and preferred suppliers selection. The resulting dataset then is analyzed to identify the preferential treatment of suppliers, pointing to bribery; discrepancies in purchase orders, invoices, and receipts – resulting in overbilling or under-delivery; unusually close relationships between suppliers and specific employees, revealing conflicts of interest.
3.2. Sales and marketing
Personalization is key to reaching more consumers, as every marketer will confirm. With the expansion of Big Data and related solutions, brands are increasingly using Big Data to improve their marketing efforts and bottom lines.
One example is McDonald’s, moving from mass marketing to mass customization. The drive-through menus change in specific McDonald’s restaurants depending on the time of day, weather, and historical sales data. Thus, cold drinks will feature more prominently on hot days, and instead of “Would you like fries with that?” customers may be offered a coffee with their breakfast.
Netflix is another company using Big Data extensively to ensure customer retention. For example, Netflix records what shows users are watching and at what time of the day, how are they doing it – binge-watch a series or taking a few days to finish a single episode, in addition to the type of movie and its genre. In addition, the company is planning for the ultimate personalization, creating individual trailers for each subscriber. This type of Big Data effort by Netflix underpins its stunning customer retention rate – 93%.
3.3. HR Management
A global fast-food restaurant chain applied Big Data to improve recruitment, training, and managing staff. The organization analyzed its internal structured data, unstructured data in the form of surveys, and semi-structured data, coming from sensors worn by employees during their shifts, tracking their movements and intensity of interactions.
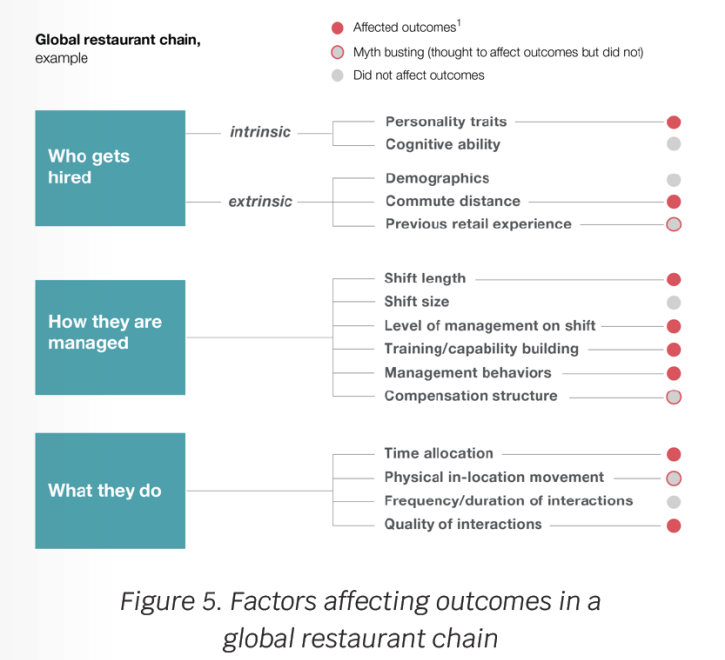
The complete data set consisted of 10,000 data points, including data on individuals, shifts at different days of the week, the financial performance of outlets, and covered four US markets. The data set was then analyzed using Big Data and Artificial Intelligence techniques. The analysis uncovered a cluster of exciting insights, shown in Figure 5, challenging and confirming conventional wisdom. For example, previous experience and compensation structure didn’t matter much, while the length of shifts and commute distance impacted outcomes.
After four months, this Big Data initiative created substantial benefits for the chain – customer satisfaction is up by 100%, and sales increased by 5%.

4. Summary
The growth in Big Data was significant before 2020, but COVID-19, due to the restricted movement of people and goods and the resulting expanded use of digital technology, undoubtedly accelerated that trend. Consequently, organizations are now accumulating significant amounts of data. Those who make a sustained effort to harness its power will thrive; the rest will merely survive in a best-case scenario.
This article provided an overview of Big Data and its characteristics and examined specific examples of how Big Data can improve organizational performance. It is important to remember that any Big Data initiative needs to start with a business outcome as its focus. Organizations with little experience in the area are advised to use Porter’s organizational value chain as a starting point.